This article is half-done without your Comment! *** Please share your thoughts via Comment ***
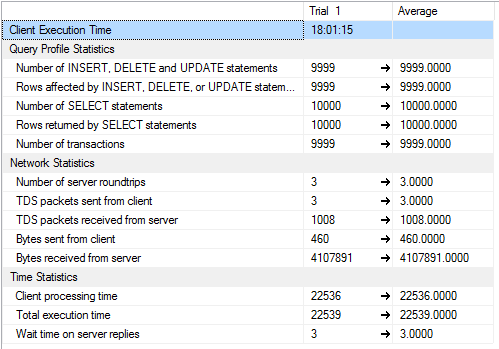
In this post, I am sharing a SSMS Client Statistics Screen Shot to get more details than STATISTICS IO of SQL Server.
While troubleshooting the performance of a query, we enable the STATISTICS IO to check the number of data like total logical reads, total physical reads. The basis of this result, we are taking few decisions for tuning our SQL queries.
But, What if you want to know more statistics of your queries.
What is the other option to get more statistical information of query?
The Option is Client Statistics which you can enable in SSMS by pressing a key (Shift + Alt + S) or find Client Statistics button next to Actual Execution Plan button.
Once you enable Client Statistics, you can get main three types of more statistics like Query Profile Statistics, Network Statistics, Time Statistics.
Execute below sample code and check your Client Statistics in SSMS:
|
1 2 3 4 5 6 7 8 9 10 11 |
CREATE TABLE tbl_ids (ID INTEGER) GO DECLARE @id INT; SET @id=1; WHILE @id < 10000 BEGIN INSERT tbl_ids VALUES(@ID) SET @id = @id + 1; END |


Leave a Reply